What gets measured
Eight categories, produced for every game we break down. Each one is filterable by player, game, selected stretch, or full season, and each one opens the film behind it.
| Code | Category | What it contains |
|---|---|---|
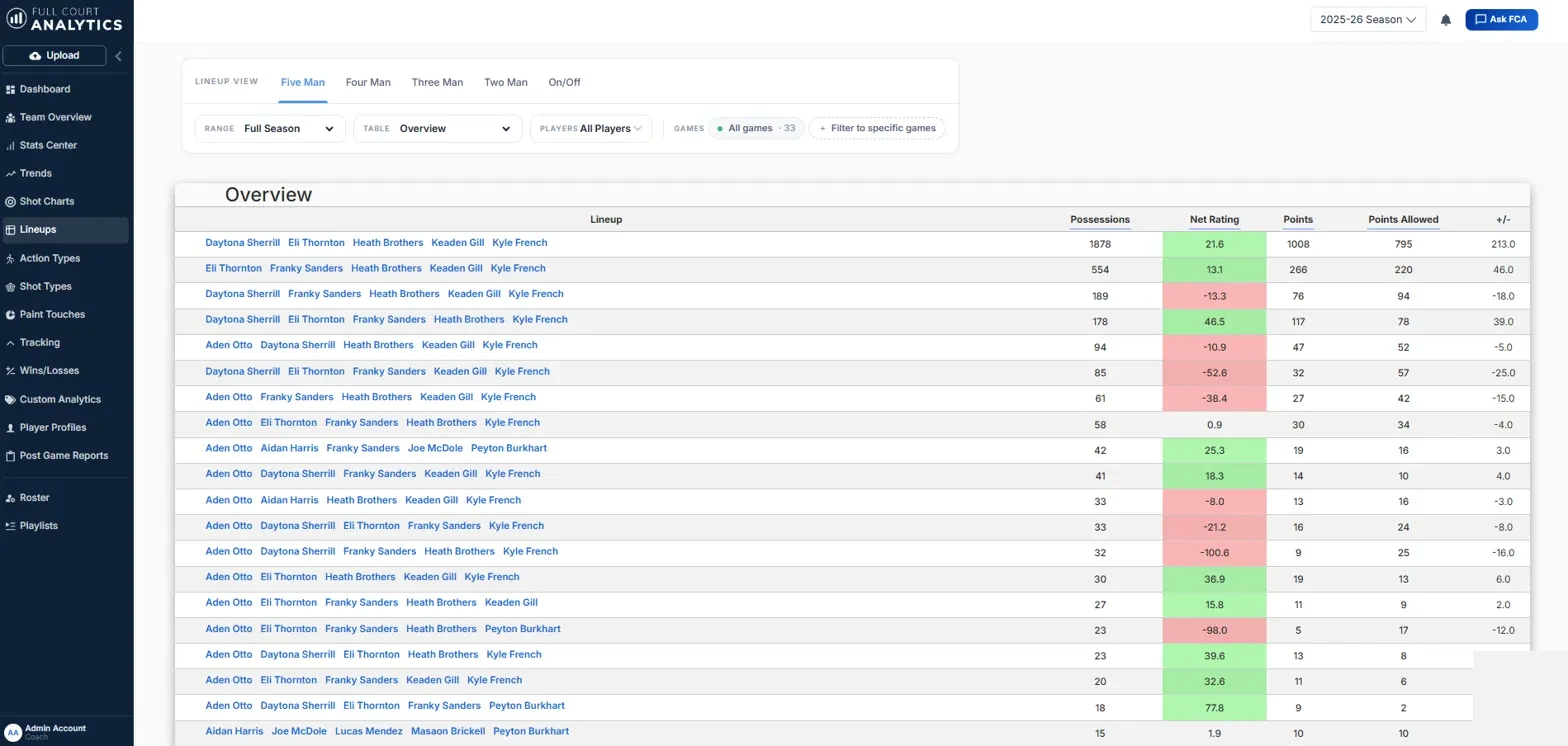
| LNP | Lineups | Every five, four, three, and two player combination with minutes, possessions, offensive and defensive rating, net rating, Four Factors, and on/off impact. |
| ACT | Action Types | Pick and rolls, DHOs, isolations, post ups, cuts, spot ups, and drives, measured by frequency, points, points per possession, and shot result. |
| PNT | Paint Touches | Paint touch versus no paint touch possessions on offense and defense, compared by possession share, points, PPP, and shooting results. |
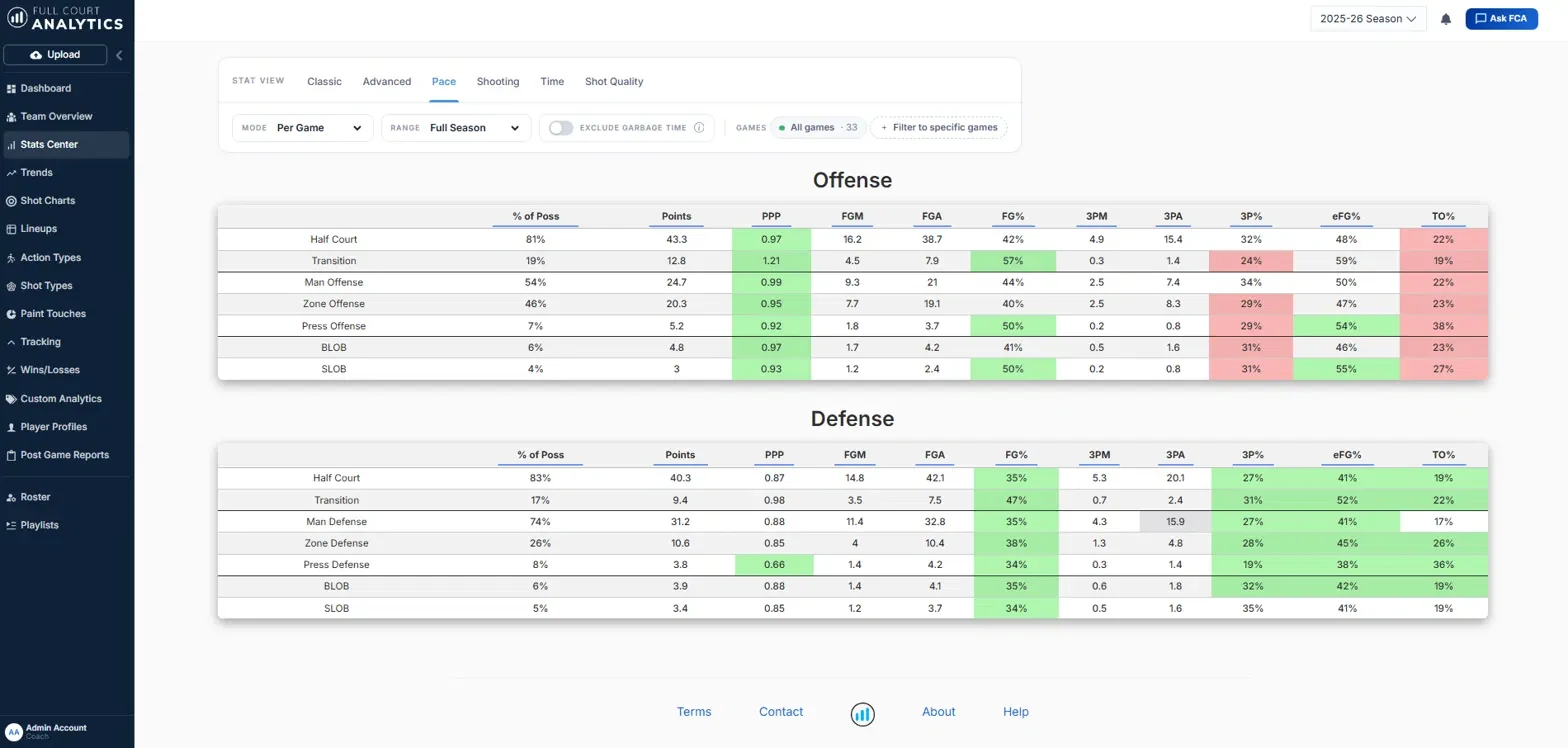
| PCE | Pace and Situations | Half court and transition splits on both ends, with possession share, PPP, eFG%, turnover rate, and custom date ranges. |
| SHT | Shot Quality | Shot location, shot type, creation method, and contest level, filterable by player, quarter, situation, action, or game. |
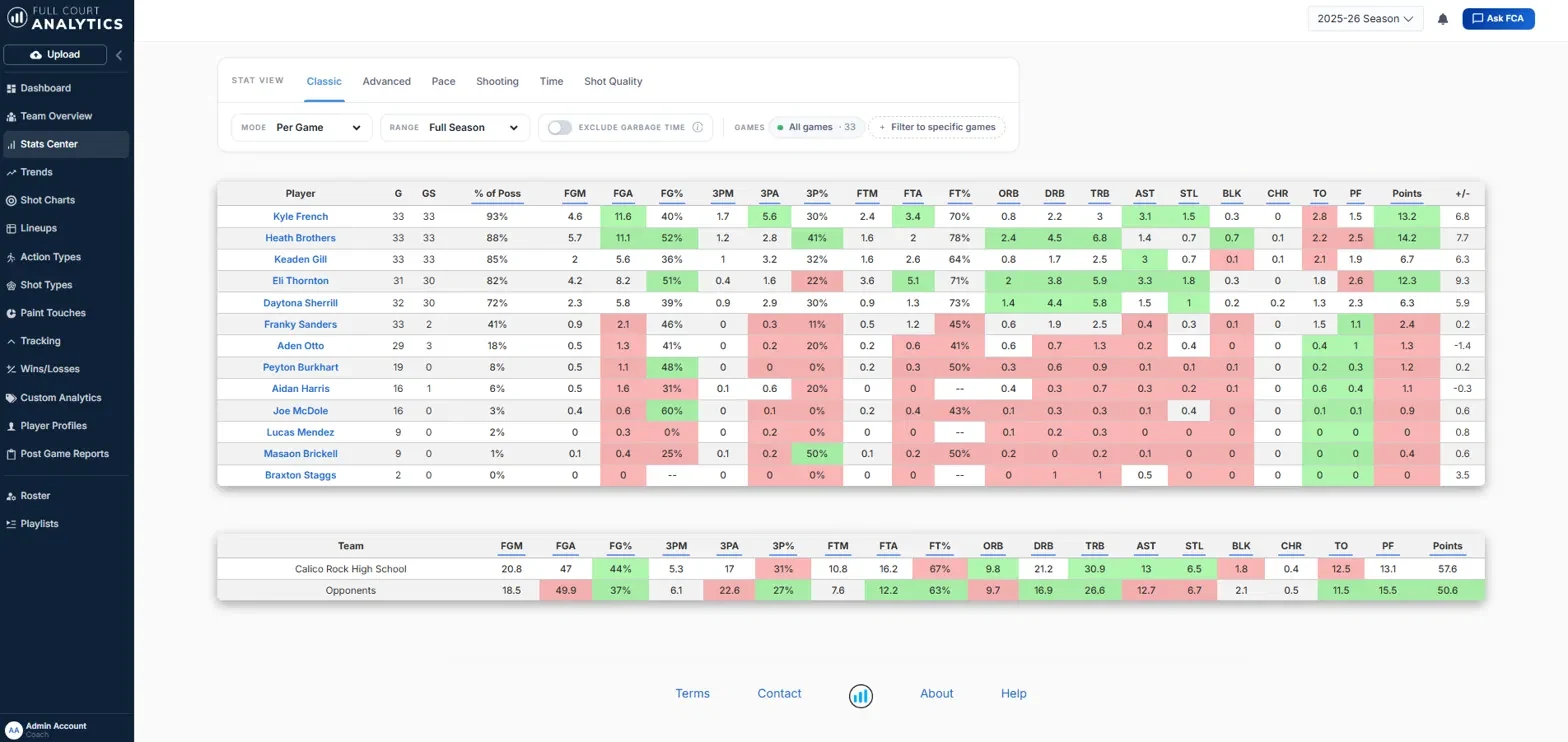
| BOX | Box and Advanced | Full box score plus ratings, shooting, usage, and rebounding metrics, with percentile context for every team and player number. |
| PLR | Player Profiles | Game logs, shot charts, action usage, shot types, drive direction, role, trends, and on/off impact for each athlete. |
| SCT | Opponent Scouting | Team and player tendencies built from opponent film, editable with your own keys, terminology, personnel notes, and priorities. |
Every possession is filed by situation
Because possessions are tagged individually rather than estimated from a box score, any of these can be isolated on offense, on defense, or both, for one game or the whole season.
Filters combine. Zone defense, half court, no paint touch allowed, fourth quarter, is a single view.
How the data gets built
This is a full service operation, not software you have to feed. Keep the filming setup you already use.
Your film
Upload from your device or paste a Hudl or NFHS download link. One to two minutes of work after the game.
Two analysts
The same two analysts are assigned to your program all season, so the tagging stays consistent game to game.
Checked by a person
Analysts review the data before it ships. Numbers are read by someone who watched the game.
Under 24 hours
Reports arrive by email. Every stat, chart, lineup, and clip is organized in the platform for staff and players.
The data and the film are the same object
A percentage you cannot verify is a percentage you cannot coach. In the platform, clicking a number takes you straight to the possessions that produced it.
- Net ratingOpens lineup clips
- PPP by actionOpens those actions
- eFG% by zoneOpens those shots
- Paint touchesOpens the entries
- Player stat lineOpens his possessions
Founded by Josh Kelly
A former Division I assistant coach at Purdue Fort Wayne, Josh founded Full Court Analytics to put the same possession level data he used in college in the hands of high school and AAU staffs. The company is based in Fort Wayne, Indiana.